Tracking Disinformation on Social Media Platforms
What is our project about?
Background
According to a study published in Science by MIT Sloan professor Sinan Aral and Deb Roy and Soroush Vosoughi of the MIT Media Lab, false rumors spread faster and wider than true information. They also found that rumors are 70% more likely to be retweeted on Twitter then the truth and hence reach people six times or more faster. The research also found this effect to be more pronounced for political news. This calls for more attention than ever to tackle these issues which can measure and analyse disinformation in social media.
Disinformation is verifiably false content that is created and disseminated for economic gain or to intentionally deceive the public and cause public harm. Disinformation campaigns on social media platforms have increased significantly over the past few years. There is a need among technology companies, journalists, and researchers to track and map disinformation campaigns more quickly and effectively.
Objective
Microsoft’s Defending Democracy Program seeks to develop a tool that can track the phenomenon of the spread of disinformation and analyze it. The tool would provide an easy-to-use interface for users to search about a trending topic of their interest and to see some great insights of our backend models in the form of a graph visualization.
Who are our stakeholders?
Our project aims at building a simple web-based tool for the following entities:
- political entities
- human rights organizations
- journalists
- concerned citizens who wish to learn about detecting and analyzing disinformation in social media.
How did we go about it?
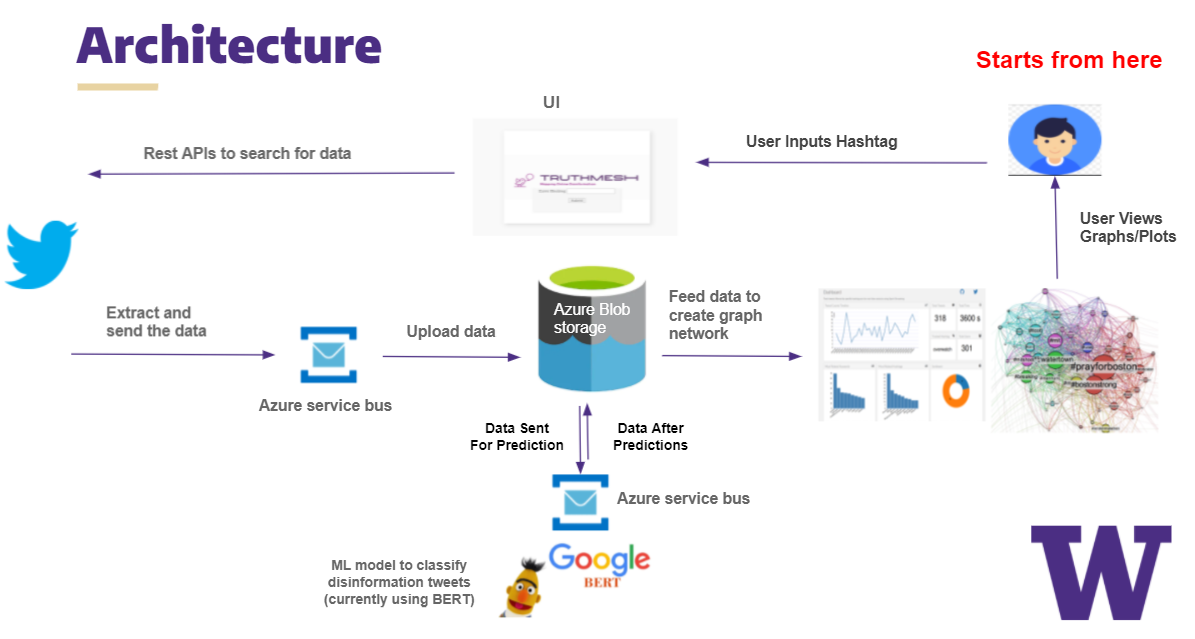
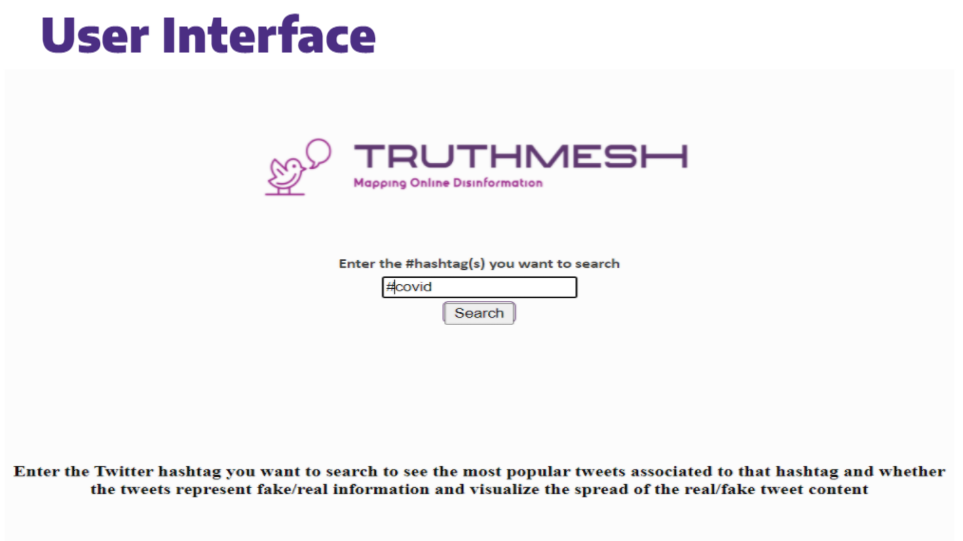
Our easy-to-use web interface allows users to search for a topic they would like to analyze and see patterns of disinformation for. This platform is highly scalable such that it can handle multiple user requests at once. Once a user sends the request, it goes into a pipeline that has four major components.
- Data Extraction - Based on this topic given by the user, we will fetch data from social media for that topic and store it in the backend for further steps.
- Machine Learning - Next, this data will flow into the Machine Learning model where each record will be classified as being either real or fake.
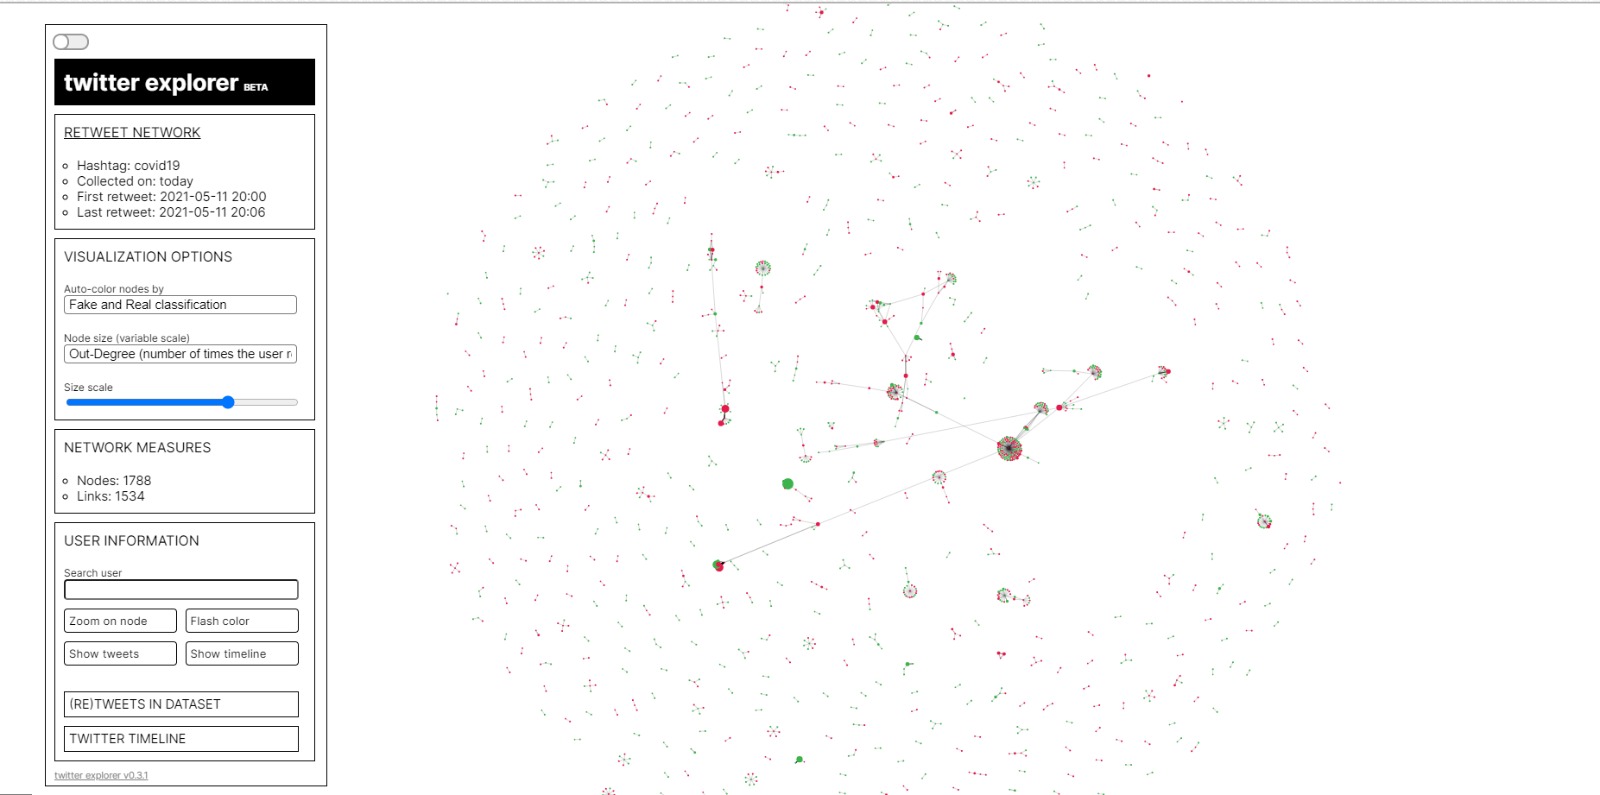
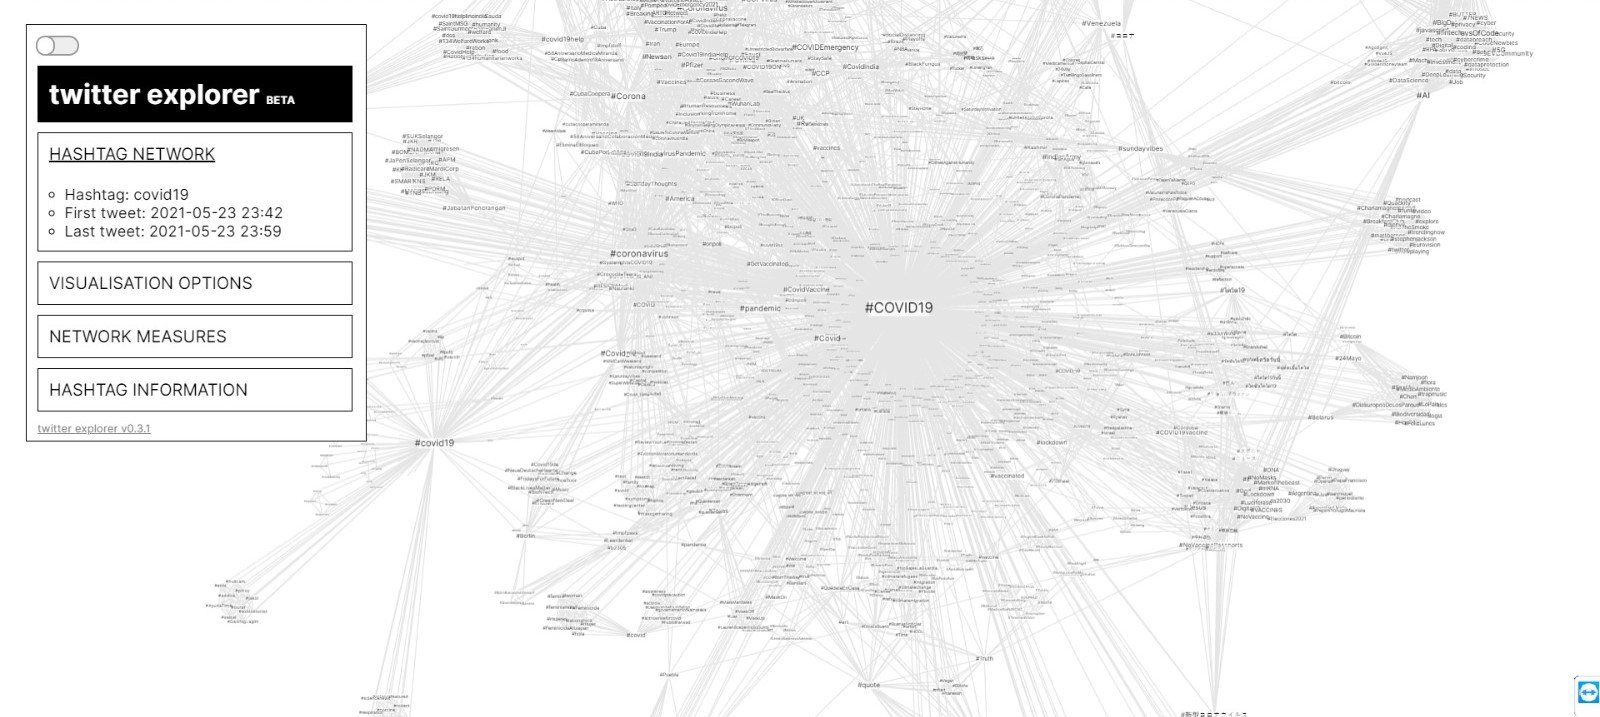
- Visualization - Once the classification is complete, this data will then flow to the visualization pipeline where we’ll create visualizations like the graph network and several others.
- User Interface - These visualizations will be available for the user to view, along with a feature that lets them download the underlying data (along with the classification tags)
What does the end product look like?
What are the benefits of this project?
We earlier talked about our stakeholders. Now let us talk about how this tool will benefit each of them:
- Political Entities - Imagine you are a political entity that wishes to keep track of any political propaganda created by any other political party.
- Human Rights Organization - Imagine are a part of the human rights organization that wants to keep track of any human rights violations propagated in the form of fake news.
- Journalists - if you are a journalist wanting to write about a topic that has gained popularity very recently.
- Concerned Citizen - If you are just a concerned citizen who came across a new Twitter campaign, and wants to know if these tweets are actually true or are just another cyber propaganda.
Using cutting-edge AI, our tool will facilitate all these stakeholders to get the information they need to make more informed decisions.
To summarize, here are some of the useful features that our product will have:
- A easy-to-use, scalable, cloud-based tool that would collect recent information about a topic from social media
- In-depth visualizations like that network graphs along with several other plots that could help track the spread of a topic or news on social media
- Generating reliable predictions using Machine Learning that would be used to create the above visualizations mentioned above
- Ability for the users to download this information in raw format in case they need it
Who we are?

| Malvika Mohan | Prathamesh Mahankal | Subhiksha Mukuntharaj | Meghana Parab |
| mmohan05@uw.edu | psm1695@uw.edu | subhi@uw.edu | megs1695@uw.edu |